Comprehensive Environmental Strategy Supports a Lower Carbon Future
Modernizing our natural gas distribution and transmission system is a core component of our vision to become the safest provider of natural gas services. Modernization not only enhances safety and reliability but also reduces emissions.
Natural gas is essential for meeting the nation’s energy demands. Carbon (CO2) emissions from residences using natural gas for space heating, water heating, cooking, and clothes drying are approximately 18% lower than those attributable to an all-electric home.[1]
In fiscal year 2023, Atmos Energy continued to execute our comprehensive environmental strategy focused on reducing Scope 1, 2, and 3, as defined in the Greenhouse Gas Protocol,and other environmental impacts from our operations, fleet, facilities, gas supply, and customer end-use.

“Atmos Energy works to reduce its emissions by improving the energy efficiency of our facilities, and great care is taken to incorporate environmentally responsible materials into the design of our new service centers.”
Zach White, Operations Supervisor
Sustainability Commitments and Governance
Our leadership provides structured accountability to successfully achieve our vision of operating safely and reliably, now and into the future. The Corporate Responsibility, Sustainability, and Safety (CRS&S) Committee of the Board of Directors oversees matters relating to responsibility, sustainability, health and safety, the Company’s vision, values, culture, and diversity, stakeholder relations, and climate change risk. The CRS&S Committee is committed to the following:
- Investing strategically in the enhancement of our environmental and operational sustainability
- Monitoring current and emerging political and social action, public policy, and environmental issues that may affect business operations, material financial performance, or the public image of the Company
- Assisting management in setting strategy, establishing goals, and integrating responsibility and sustainability into strategic and tactical business activities across the Company to create long-term shareholder value
Our Management Committee is comprised of five senior leaders responsible for the execution of company strategy as approved by the Board. The Committee meets regularly to actively monitor, among other matters, activities related to the comprehensive environmental strategy and related operational and environmental performance.
Environmental Management
 Our Vice President of Pipeline Safety provides strategic direction and plan oversight of our operational sustainability, environmental, and compliance efforts. Our Director of Environmental Practices supports this effort, assisting with ongoing environmental stewardship programs. Our Division Presidents (who are also Corporate Officers) lead our operating divisions and are responsible for executing our environmental strategy in their operating areas. Operating Division employees steward day-to-day compliance with applicable regulations, support the implementation of environmental initiatives, and provide feedback on improving our processes. We also require that all contractors be knowledgeable of and comply with all applicable federal, state, and local environmental requirements.
Atmos Energy employees adhere to all applicable environmental laws and regulations, related corporate policies and procedures, and the requirements, limitations, and conditions of all environmental permits. As described in our Code of Conduct, Atmos Energy is committed to:
- Minimizing the release of any environmentally damaging substance
- Minimizing the creation of waste
- Disposing of all waste through safe methods
- Employing safe technologies and operating procedures
- Being prepared to respond appropriately to accidents and emergencies
Under the direction of our Vice President of Pipeline Safety, a cross-functional Emissions Reduction Team continues to support the Company’s operating divisions in executing the strategy. The team is comprised of representatives from the safety, operations, technical services, engineering, environmental, compliance, legal, and business process and change management groups of our business. Its accomplishments include:
- Supporting sustainable system modernization and emission reduction efforts, including:
- Replacing nearly 900 miles of pipe and approximately 24,500 steel service lines
- Replacing over existing 200 high-bleed pneumatic devices with low- or no-bleed devices
- Commencing a multi-year project to install instrument air systems to reduce methane emissions from pneumatic devices at storage and compression facilities in Texas
- Reducing blowdown emissions using recompression technologies and best practices during pipeline maintenance and construction activities
- Continuing our multi-year fleet conversion program towards gas/electric hybrid and compressed natural gas (CNG), including utilizing four proprietary CNG refueling stations located at Atmos Energy service centers
- Continuing execution of our renewable natural gas (RNG) strategy
- Developing and implementing plans to enhance our emissions monitoring systems, including:
- Completing the installation of Gas Cloud Imaging monitoring systems at our APT storage and compression facilities
- Launching a multi-year program to install advanced monitoring technologies at our other storage & compression facilities
- Expanding our Advanced Mobile Leak Detection (AMLD) vehicle fleet in Colorado, Mississippi, and Tennessee, bringing our total to fifteen (15) AMLD vehicles, at least one in every state in which we operate
- Implementing an enterprise-wide electric utility bill processing system to support Scope 2 emissions quantification and monitoring
- Implementing practices to monitor the effectiveness of our emissions reduction initiatives
- Meeting periodically to review emissions reduction initiatives and confirm alignment with Atmos Energy’s vision, strategy, and culture
- Reporting to the Management Committee and the CRS&S Committee on matters about the team's goals, activities, and achievements
Greenhouse Gas Reduction Initiatives
Atmos Energy’s comprehensive environmental strategy focuses on reducing Scope 1, 2, and 3 emissions (as defined by the Greenhouse Gas Protocol) and other environmental impacts from our operations, fleet, facilities, gas supply, and customer end-use. We are implementing operating practices and solutions to reduce carbon from our operations through:
- Ongoing system modernization work
- Reducing third-party damage to our system
- Improving monitoring and measuring of methane emissions
- Evaluating and implementing innovative technologies
- Investing in research and development
- Collaboration with legislators, regulators, customers, and suppliers
Atmos Energy is working towards a goal to reduce methane emissions from its natural gas distribution system mains and services by 50% from 2017 to 2035, as reported to the EPA in accordance with 40 CFR 98 Subpart W. This goal reflects the environmental benefit associated with system modernization efforts through the replacement of higher emitting pipeline materials with lower emitting pipe materials, as defined by US EPA. As of calendar year end (CYE) 2023, we have achieved an approximate 23% reduction from CY2017.
To better measure improvements in our system’s environmental performance, we have voluntarily participated in the American Gas Association’s and Edison Electric Institute’s Natural Gas Sustainability Initiative since its inception in 2017. Our involvement has helped us more effectively calculate our methane emissions intensity factor, which has decreased by approximately 31% since 2017. The chart below illustrates this downward trend. The implementation of our recompression practices to reduce venting from pipeline maintenance activities is reflected in our Transmission & Storage methane intensity reductions beginning in CY2021. Our system modernization program, including removing cast iron from our system at the end of CY2021, has driven our continued reduction in Distribution system methane intensity. Because this methane intensity calculation does not weather-normalize our gas delivery volumes, fluctuations in heating degree days can cause corresponding fluctuations in our Distribution system methane intensity (e.g., CY2022 had more heating degree days and higher gas delivery volumes than CY2021 and CY2023, resulting in a lower intensity).
[a] Determined and reported on a calendar year basis per the American Gas Association and Edison Electric Institute’s Natural Gas Sustainability Initiative (NGSI) Version 1 Protocol. Natural Gas ESG/Sustainability | American Gas Association (aga.org) Gas delivery volumes are not weather normalized.
[b] Includes methane leak sources reported under EPA GHG Mandatory Reporting Rule Subpart W, 40 CFR §98.232(i)(1-6). Combustion sources are excluded. CO2 is excluded.
[c] Includes methane leak sources estimated per EPA GHG Mandatory Reporting Rule Subpart W, 40 CFR §98.232(e)(1-8), (f)(1-8), and (m). Combustion sources are excluded. CO2 and N2O are excluded.
 EPA Methane Challenge
In support of our efforts to reduce methane emissions, in 2016, we became a founding member of the Environmental Protection Agency’s (EPA) Natural Gas STAR Methane Challenge Program. This voluntary partnership publicly monitored and recognized oil and natural gas companies making commitments to reduce methane emissions in their operations. In April 2024, the EPA announced its discontinuation of the Methane Challenge Program, effective after issuing its final Methane Challenge Report for calendar year 2022 data. Accordingly, Atmos Energy is discontinuing this disclosure related to the EPA Methane Challenge.
 ONE Future Coalition
Since 2020, Atmos Energy has been a member of Our Nation’s Energy Future Coalition (ONE Future). ONE Future is a voluntary alliance of leading companies across the natural gas supply chain focused on technology and policy solutions to drive continual improvement in reducing methane emissions. Our participation in ONE Future reflects our continued commitment to sustainable practices in our natural gas distribution, pipeline, and storage operations.
As a ONE Future member, Atmos Energy collaborates with other members to share knowledge pertaining to methane emissions reductions, for the purpose of voluntarily reducing methane emissions across the natural gas value chain to achieve a methane intensity of 1% or less by 2025. Members also commit to measuring, reporting, and tracking key emissions in accordance with ONE Future protocols. In calendar year 2022, the most recent year where data is available, ONE Future members maintained a methane intensity rate of 0.421%, meaning members were over 99.5% efficient in delivering energy from the source to end-use. This efficiency exceeds ONE Future’s goal by approximately 58% while safely and reliably delivering natural gas to customers.[1]
Atmos Energy participates in the Transmissions & Storage segment and the Distribution segment. These two ONE Future segments achieved a combined methane intensity of 0.183% against a goal of 0.526%, exceeding the goal by approximately 65%.
 Low Carbon Resources Initiative
Consistent with our principle of focusing on the future, Atmos Energy has invested in the Low Carbon Resources Initiative (LCRI), a collaborative initiative driven by the Electric Power Research Institute and the Gas Technology Institute. LCRI specifically targets advances in the production, distribution, and application of low-carbon, alternative energy carriers and the cross-cutting technologies that enable their integration at scale. These energy carriers, including hydrogen, ammonia, synthetic fuels, and biofuels, are needed for affordable pathways to support deep carbon reductions across the energy economy. The LCRI is focused on technologies that can be developed and deployed beyond 2030 to support a net zero-emission economy by 2050.
Through our membership with LCRI, Atmos Energy supports independent, objective technical and economic research performed by global subject matter experts. These studies help inform our evaluation of new technologies and processes for application to our comprehensive environmental strategy as we focus on the future.
 GTI Veritas
In 2022, Atmos Energy joined the Veritas Initiative, a methane emission measurement and verification initiative led by GTI Energy. Through the Veritas Initiative, dozens of industry, research, and environmental stakeholders collaborated in a transparent, science-based methane measurement protocol development process. The goal was to develop open-source technical protocols that provide companies and countries with a consistent approach to measuring and verifying methane emissions - enabling a credible, consistent, verifiable, and transparent methodology.
 North American Gas Heat Pump Collaborative
In 2023, Atmos Energy joined the North American Gas Heat Pump Collaborative (The Collaborative), an organization with a mission to accelerate the adoption of innovative gas technologies that will reduce carbon emissions in North America. The Collaborative was founded in 2022 and comprises utilities recognizing the tremendous opportunities made possible by gas heat pump technology. Since joining the Collaborative, Atmos Energy has been engaged alongside energy efficiency advocates and other peer companies, to examine the benefits of highly efficient gas heat pump technologies and facilitate developing the market for residential and commercial adoption of gas heat pumps.
GHG Emissions Data
In fiscal year 2023, we developed a comprehensive process and methodology to calculate and track greenhouse gas (GHG) emissions. Our methodology uses the World Resources Institute GHG Protocol from material source categories, including calculating emissions by GHG type and global warming potential (GWP) by region, division, facility, and activity. We also began implementing a software platform to facilitate data collection and processing, emissions calculations, and reporting. We plan to evaluate verification methodologies for disclosures that align with applicable guidelines and requirements.
We also monitor and report GHG emissions in accordance with the EPA Greenhouse Gas Reporting Rule, codified in 40 Code of Federal Regulations Part 98, which requires reporting of GHG data and other relevant information from large sources in the United States. We classify our EPA-reported GHG emissions into three primary categories:
- Distribution — 40 CFR 98 Subpart W, Scope 1
- Transmission — 40 CFR 98 Subpart C and Subpart W, Scope 1
- Customer End Use — 40 CFR 98 Subpart NN, Scope 3
Subparts C and W require reporting Scope 1 GHG emissions from combustion and petroleum and natural gas systems, respectively, for facilities that emit 25,000 mtCO2e or more annually. Subpart NN requires reporting of Scope 3 customer end-use emissions from all local natural gas distribution companies that physically deliver at least 460 million standard cubic feet of natural gas to customers and operate within a single state. Emissions generated by customer end use of our natural gas product comprise a significant portion of our Scope 3 and total GHG emissions.
The chart below summarizes our total estimated EPA-reportable GHG emissions by category since our baseline year of 2017. As shown, Scope 3 emissions comprise the largest share of our carbon footprint, with approximately 94% of our total reported emissions deriving from customer end use.
Several factors influence our annual GHG emissions totals, including the expansion of our distribution system, fluctuations in customer end use, and our ongoing system modernization efforts. The general increase in our total reported emissions since 2017 is mainly due to customer growth and system expansion to meet rising customer demand.
Transmission System GHG Emissions[a]
| Total GHG Emissions (MT CO2e) | |||||||
| Subpart/Reporting Entity | CY2017 | CY2018 | CY2019 | CY2020 | CY2021 | CY2022 | CY2023 |
| 40 CFR 98 Subpart C[b] (Scope 1) | |||||||
| Central Compressor Station[c] | 4,387 | 11,259 | 8,855 | 7,969 | - | - | - |
| Cooper Compressor Station[c] | 6,012 | 8,077 | 11,615 | 11,837 | - | - | - |
| Groesbeck Compressor Station[d] | - | - | 32,971 | 36,076 | 34,136 | 30,753 | 29,785 |
| Howard Compressor Station | 47,658 | 40,478 | 57,696 | 65,332 | 64,106 | 59,911 | 59,471 |
| Maryneal Compressor Station[d] | - | - | 36,504 | 35,690 | 31,426 | 32,943 | 31,891 |
| Total | 58,057 | 59,814 | 147,641 | 156,905 | 129,668 | 123,607 | 121,148 |
| 40 CFR 98 Subpart W[e] (Scope 1) | |||||||
| Atmos Pipeline—Texas | 146,756 | 204,568 | 112,132 | 84,078 | 27,231 | 21,465 | 24,261 |
| Central Compressor Station[c] | 758 | 1,033 | 2,458 | 2,660 | - | - | - |
| Cooper Compressor Station[c] | 1,349 | 1,116 | 1,158 | 2,179 | - | - | - |
| Groesbeck Compressor Station[d] | - | - | 1,100 | 1,468 | 2,418 | 2,287 | 1,848 |
| Howard Compressor Station | 3,260 | 4,023 | 2,524 | 1,743 | 2,694 | 6,620 | 6,997 |
| Maryneal Compressor Station[d] | - | - | 852 | 723 | 513 | 790 | 562 |
| Total | 152,124 | 210,740 | 120,224 | 92,852 | 32,857 | 31,668 | 33,668 |
| Transmission Total Emissions | 210,181 | 270,554 | 267,865 | 249,757 | 162,525 | 154,769 | 154,816 |
| Methane Emissions (MT CH4) | |||||||
| Subpart/Reporting Entity | CY2017 | CY2018 | CY2019 | CY2020 | CY2021 | CY2022 | CY2023 |
| 40 CFR 98 Subpart C[b] (Scope 1) | |||||||
| Central Compressor Station[c] | 0.08 | 0.21 | 0.17 | 0.15 | - | - | - |
| Cooper Compressor Station[c] | 0.1 | 0.16 | 0.22 | 0.22 | - | - | - |
| Groesbeck Compressor Station[d] | - | - | 0.62 | 0.68 | 0.64 | 0.58 | 0.56 |
| Howard Compressor Station | 0.89 | 0.76 | 1.10 | 1.23 | 1.21 | 1.12 | 1.13 |
| Maryneal Compressor Station[d] | - | - | 0.69 | 0.67 | 0.59 | 0.62 | 0.60 |
| Total | 1.07 | 1.13 | 2.80 | 2.95 | 2.44 | 2.32 | 2.29 |
| 40 CFR 98 Subpart W[e] (Scope 1) | |||||||
| Atmos Pipeline—Texas | 5,854.97 | 8,161.42 | 4,473.61 | 3,354.35 | 1,086.40 | 856.37 | 967.91 |
| Central Compressor Station[c] | 30.31 | 41.28 | 98.20 | 106.27 | - | - | - |
| Cooper Compressor Station[c] | 53.92 | 44.59 | 46.26 | 87.08 | - | - | - |
| Groesbeck Compressor Station[d] | - | - | 43.94 | 58.66 | 96.61 | 91.38 | 73.88 |
| Howard Compressor Station | 128.01 | 160.75 | 100.86 | 69.66 | 107.64 | 264.53 | 297.72 |
| Maryneal Compressor Station[d] | - | - | 34.06 | 28.87 | 20.51 | 31.55 | 22.46 |
| Total | 6,067.2 | 8,408.0 | 4,796.9 | 3,704.9 | 1,311.2 | 1,243.8 | 1,344.0 |
| Transmission Total Emissions | 6,068.3 | 8,409.2 | 4,799.7 | 3,707.8 | 1,313.6 | 1,246.2 | 1,346.3 |
[a] As reported to the U.S. Environmental Protection Agency in accordance with 40 CFR Part 98, Subparts C and W.
[b] Emissions from the combustion of natural gas in our stationary fuel combustion sources are calculated in accordance with 40 CFR Part 98, Subpart C, equation C-1, using the volume of fuel fired, default heating value, and fuel-specific emission factors, per §98.33.
[c] Atmos Energy acquired these facilities in CY2017. Each facility emitted less than the reporting threshold of 25,000 MT/yr CO2e for 5 consecutive years and discontinued reporting in CY2021.
[d] These facilities emitted less than the reporting threshold of 25,000 MT CO2e in calendar years 2017 and 2018.
[e] Emissions from transmission system operations are calculated in accordance with 40 CFR 98 Subpart W, using operating data, measurements, leak survey data, and population counts per §98.236(b, i, k, and n-r).
Distribution System GHG Emissions[a]
| Total GHG Emissions (MT CO2e) | |||||||
| Subpart/Reporting Entity | CY2017 | CY2018 | CY2019 | CY2020 | CY2021 | CY2022 | CY2023 |
| 40 CFR 98 Subpart W (Scope 1) | |||||||
| Colorado | 26,282 | 24,624 | 24,759 | 24,340 | 22,833 | 23,800 | 21,470 |
| Kansas | 22,789 | 22,122 | 23,138 | 24,108 | 23,303 | 23,232 | 24,955 |
| Kentucky | 30,600 | 27,370 | 27,025 | 25,479 | 24,440 | 23,443 | 22,876 |
| Louisiana | 49,684 | 51,350 | 51,809 | 50,207 | 50,292 | 58,355 | 53,665 |
| Mississippi | 54,417 | 50,848 | 47,282 | 47,971 | 56,268 | 65,173 | 68,155 |
| Tennessee | 19,006 | 17,402 | 17,259 | 17,577 | 17,833 | 18,081 | 19,290 |
| Texas | 519,126 | 481,624 | 474,905 | 437,153 | 394,677 | 388,144 | 369,202 |
| Virginia | 2,591 | 2,673 | 2,656 | 2,663 | 2,654 | 2,670 | 2,693 |
| Total | 724,494 | 678,012 | 668,832 | 629,496 | 592,300 | 602,899 | 582,305 |
| Mains and Services Only | 646,337 | 602,111 | 580,364 | 554,727 | 516,864 | 467,823 | 495,686 |
| Methane Emissions (MT CH4) | |||||||
| Subpart/Reporting Entity | CY2017 | CY2018 | CY2019 | CY2020 | CY2021 | CY2022 | CY2023 |
| 40 CFR 98 Subpart W (Scope 1) | |||||||
| Colorado | 1,050.03 | 983.76 | 989.18 | 972.41 | 912.22 | 950.84 | 857.75 |
| Kansas | 910.45 | 883.80 | 924.39 | 963.16 | 930.99 | 928.17 | 997.01 |
| Kentucky | 1,222.53 | 1,093.49 | 1,079.70 | 1,017.93 | 976.41 | 936.60 | 913.93 |
| Louisiana | 1,984.95 | 2,051.51 | 2,069.86 | 2,005.87 | 2,009.26 | 2,151.61 | 2,144.00 |
| Mississippi | 2,174.07 | 2,031.45 | 1,889.02 | 1,916.51 | 2,248.01 | 2,603.79 | 2,722.93 |
| Tennessee | 759.31 | 695.24 | 689.51 | 702.22 | 712.45 | 722.38 | 770.69 |
| Texas | 20,740.02 | 19,241.76 | 18,973.31 | 17,465.05 | 15,768.09 | 15,507.07 | 14,750.28 |
| Virginia | 103.50 | 106.80 | 106.10 | 106.38 | 106.05 | 106.69 | 107.58 |
| Total | 28,944.9 | 27,087.8 | 26,721.1 | 25,149.5 | 23,663.5 | 23,907.2 | 23,264.2 |
| Mains and Services Only | 25,822.4 | 24,055.5 | 23,186.6 | 22,162.4 | 20,649.7 | 20,707.6 | 19,803.6 |
[a] As reported to the U.S. Environmental Protection Agency in accordance with 40 CFR Part 98, Subpart W.
Customer End Use GHG Emissions[a]
| Total GHG Emissions (MT CO2e) | |||||||
| Subpart/Reporting Entity | CY2017 | CY2018 | CY2019 | CY2020 | CY2021 | CY2022 | CY2023 |
| 40 CFR 98 Subpart NN (Scope 3) | |||||||
| Colorado | 810,451 | 810,451 | 882,564 | 847,382 | 839,876 | 914,469 | 875,754 |
| Kansas | 1,108,591 | 1,108,591 | 1,123,925 | 1,063,096 | 1,072,532 | 1,194,159 | 1,063,473 |
| Kentucky | 1,794,183 | 1,794,183 | 1,689,002 | 1,605,128 | 1,640,692 | 1,769,431 | 1,605,695 |
| Louisiana | 1,670,323 | 1,670,323 | 1,652,123 | 1,493,260 | 1,483,247 | 1,646,606 | 1,630,161 |
| Mississippi | 1,759,322 | 1,759,322 | 1,710,260 | 1,582,817 | 1,648,876 | 1,753,945 | 1,448,826 |
| Tennessee | 1,238,954 | 1,238,954 | 1,244,215 | 1,192,469 | 1,220,450 | 1,311,642 | 1,196,072 |
| Texas | 13,406,356 | 13,406,356 | 13,548,219 | 12,236,319 | 12,430,902 | 13,459,109 | 11,975,102 |
| Virginia | 374,699 | 374,699 | 488,511 | 326,806 | 324,403 | 353,539 | 333,429 |
| Total | 22,162,879 | 22,162,879 | 22,338,819 | 20,347,277 | 20,660,977 | 22,402,900 | 20,128,511 |
[a] As estimated and reported to the U.S. Environmental Protection Agency in accordance with 40 CFR Part 98, Subpart NN.
Non-GHG Criteria Air Pollutants
We monitor and estimate non-GHG criteria air pollutant emissions in accordance with applicable federal and state requirements and report those emissions for facilities that trigger the respective thresholds or are otherwise requested by the state regulatory agency. The following table summarizes our estimated and reported non-GHG criteria for air pollutant emissions.
| Criteria Air Pollutant (T/yr) | CY2017 | CY2018 | CY2019 | CY2020 | CY2021 | CY2022 | CY2023 |
| Carbon Monoxide (CO) | 105.43 | 138.15 | 87.39 | 87.72 | 105.57 | 89.31 | 85.96 |
| Oxides of Nitrogen (NOX) | 134.76 | 143.51 | 109.26 | 115.37 | 115.93 | 128.04 | 167.53 |
| Particulate Matter (PM) | 7.44 | 9.97 | 9.09 | 10.65 | 12.16 | 9.69 | 8.65 |
| Sulfur Dioxide (SO2) | 0.54 | 0.69 | 0.73 | 0.75 | 0.74 | 0.65 | 0.63 |
| Volatile Organic Compounds (VOC) | 63.78 | 71.97 | 44.72 | 50.18 | 54.25 | 48.72 | 35.80 |
The leading source of criteria air pollutant emissions at our facilities is the combustion of natural gas in our compressor engines and turbines. We utilize control technologies such as oxidation catalyst, nonselective catalytic reduction, and Low-NOX combustion to reduce CO, NOX, and VOC emissions. We also conduct periodic air emissions testing that meets or exceeds applicable requirements to measure emissions and verify that control technologies are working correctly. Air emissions testing results for CO, NOX, and VOC are used to estimate the reported air pollutant emission rates, resulting in fluctuations from year to year.
System Modernization
Pipeline Replacement
As part of our vision to be the safest provider of natural gas services, Atmos Energy is committed to modernizing our natural gas distribution, transmission, and underground storage systems. These projects and initiatives improve the safety and reliability of our infrastructure, reduce methane emissions, and improve our customer service and efficiency.
System Modernization
Including investments in new technology, Atmos Energy allocated approximately 85 percent of its fiscal 2023 capital spending to enhance the safety and reliability of its distribution and transportation systems, delivering efficient and affordable energy to its customers and communities. System modernization efforts include pipe replacement programs and leak repair prioritization, which further contribute to the company’s commitment to protect and preserve the environment.
In fiscal year 2023, we replaced over 900 miles of distribution and transmission pipe (about 1.2% of our total system) and approximately 24,500 steel service lines (about a 3.2% reduction from prior year). Over the next five years, we plan to replace between 4,000 and 5,000 miles of distribution and transmission pipe and between 120,000 and 170,000 steel service lines.[1] To determine the schedule for pipeline replacements, we use a risk-based prioritization model that considers the pipe’s age, location, material, leak history, environmental factors, and more. This modernization will significantly contribute to reductions in operational emissions.
(miles of pipe per fiscal year)
[1] This reduction estimate is included in our goal to reduce methane emissions from our distribution system mains and service by 50% by 2035 from 2017. Source: July 2024 Analyst Update.
(miles of pipe per fiscal year)
Using Advanced Technologies
Our team applies innovative and state-of-the-art technology, including satellite and helicopter surveys, to prioritize leak detection, monitoring, and leak repair to enhance safety and protect the environment. We regularly review technological advances as they are brought into the market to determine if they will provide increased value to our leak detection and monitoring efforts.
One example is our Advanced Mobile Leak Detection (AMLD) technology, which uses Cavity Ring-Down Spectroscopy (CRDS). The CRDS is 1,000 times more sensitive than traditional technologies. In fiscal year 2023, Atmos Energy continued our investment in this advanced leak detection technology, adding a vehicle in Tennessee and bringing our total to sixteen units, with at least one unit operating in every Division.
12,700 miles
surveyed using AMLD technology*
*Fiscal Year 2023
Additional technologies we use to detect leaks include:
- Remote Methane Leak Detection (laser-based gas detector—RMLD)
- Flame Ionization Detector (FID)
- Combustible Gas Indicator (CGI)
- Optical Methane Detector (OMD)
- Forward Looking Infrared Camera (FLIR)
- Ultrasonic Gas Leak Detection (UGLD)
- Gas Cloud Imaging Camera (GCI)
- Finally, during fiscal year 2023, we initiated pilot programs to monitor our system using satellite and other aerial methane detection.
To conduct inspections and surveys of buried and above-ground natural gas distribution and transmission pipelines and facilities, we use combinations of portable CRDS, FLIR, RMLD, FID, OMD, and CGI equipment utilizing mobile vehicles (aircraft or automobiles) and technicians (on foot). The equipment used depends upon several criteria, including but not limited to safety, weather, instrument capabilities, location, application, and operating experience. We continue to evaluate and expand the use of advanced leak detection technologies across our operations to increase the safety and reliability of our system and reduce methane leaks.
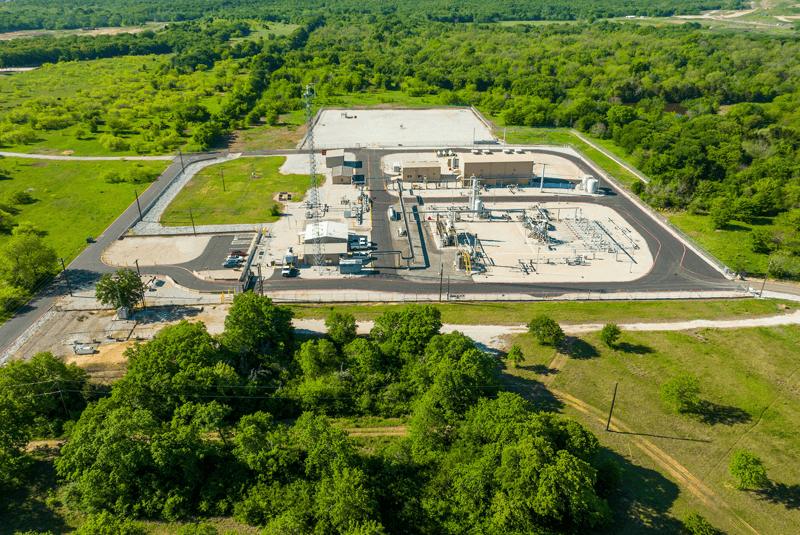
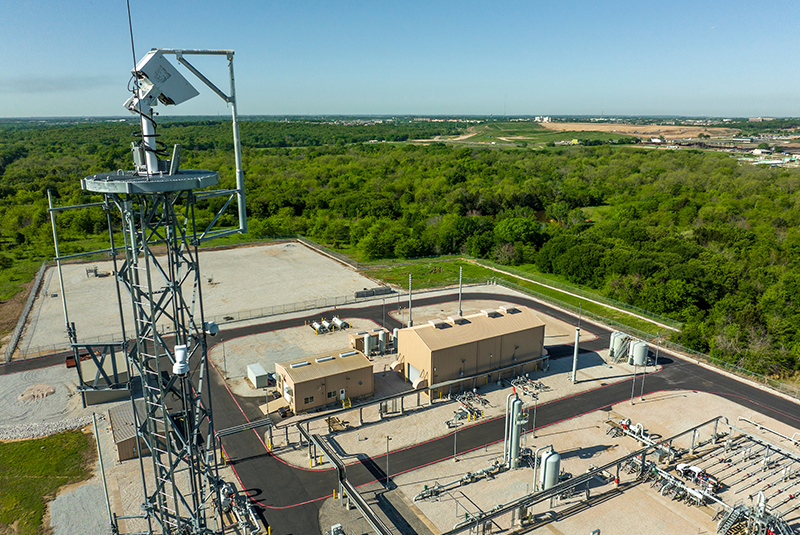
To monitor storage and compression facilities, Atmos Energy uses a variety of fixed and portable cameras and equipment to conduct inspections. We use GCI cameras at all APT storage and compression facilities. The GCI camera pans and zooms to all areas of the site, providing 24/7 coverage. GCI technology also uses imaging coupled with machine learning analytics to determine the shape of a gas plume, which measures the concentration of a leak. Each gas has a unique emission or absorption signature in the long-wave infrared spectrum, known as the fingerprint region, which makes it possible for the GCI camera to differentiate between them. Its powerful imaging engine analyzes hyperspectral data from every pixel at a rate of 60 times per second to identify more than 50 gases, capturing a gas leak on video as a visual cloud and illustrating the size and direction the plume is moving.
At our Lake Dallas storage and compression facility, we piloted UGLD technology that utilizes ultra-sensitive acoustic sensors to continuously monitor areas for ultrasound generated from pressurized gas release. We also installed FLIR cameras at our wellheads to continuously monitor for leaks. These technologies provide immediate leak warnings, enabling a rapid response and providing both safety and environmental benefits.
In fiscal year 2023, we commenced a multi-year program to install continuous ultrasonic leak detection and monitoring systems at our other storage and compression facilities. We completed the installation and commissioning of these systems at our Amory and Goodwin storage and compressor stations in Mississippi, at two of seven storage and compressor stations in Kentucky, and one station in Kansas.
Recompression
In fiscal year 2023, we continued the practice of reducing venting associated with pipeline maintenance activities by using drawdown via gas control and recompression technologies that capture and transport natural gas into another pipeline. In fiscal year 2023, these practices helped over 130 projects achieve greater than 90% savings, capturing over 211 million cubic feet (MMcf) of gas for the safe delivery to customers of reliable and efficient energy.
Pneumatic Devices
We focus on updating and replacing the pneumatic devices used in distribution, transmission, storage, and compression operations as part of our carbon reduction strategy. Most pneumatic devices are powered by natural gas where electrical power or compressed air is unavailable. Some devices vent intermittently, but continuous high-bleed devices are the greatest contributor to pneumatic device emissions. To minimize these emissions, we committed to use bleed-free or low-bleed devices on all new and replacement natural gas pneumatic devices unless a safety or functional need requires otherwise.
For our existing pneumatic devices, we commenced a multi-year proactive program to reduce emissions by replacing high-bleed devices and installing instrument air systems at our APT storage and compression facilities. Through the end of fiscal year 2023, we have removed over 350 high bleed devices from natural gas service, reducing emissions by approximately 5,600 mtCO2e annually.
[1] Source: July 2024 Analyst Update.
Improving Fleet Energy Efficiency
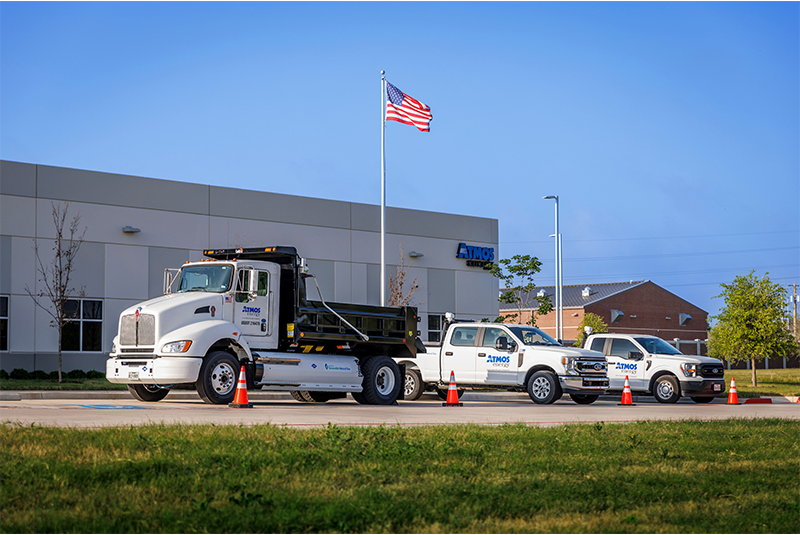 Atmos Energy’s fleet of over 4,200 vehicles, ranging in size from sport utility vehicles (SUVs) to heavy-duty trucks, is a focus area of our comprehensive environmental and carbon reduction strategy. For operational sustainability, we maintain our fleet with resilience and flexibility in mind, and we rely upon proven technologies when pursuing more energy-efficient fleet options. In fiscal year 2021, we developed a multi-year strategy to convert our fleet to hybrid-electric gas vehicles for our service and other light-duty vehicles. The plan included converting our heavy-duty vehicles to compressed natural gas (CNG) as part of our normal replacement cycle. This strategy will lead to greater fleet diversification, efficiency, and a reduction in our Scope 1 emissions.
In fiscal year 2022, we began taking delivery of hybrid-light duty trucks. We also recently completed construction of four CNG refueling stations in Texas to support fleet operations and our fleet emissions reduction strategy. These CNG stations, utilizing renewable natural gas, lower vehicle emissions by approximately 95% compared to traditional gasoline.
Biodiversity and Land Use
Atmos Energy recognizes the value of protecting the natural environment, and we work to minimize our impact in the areas where we operate. Before beginning a project, we conduct a comprehensive environmental review to understand our potential impact on water resources, state- and federal-listed species, habitat, and cultural resources. We strive to leave the smallest possible footprint when a project is finished.
Atmos Energy’s most significant land use is associated with our underground pipeline networks. We work to avoid or minimize impacts during project planning by modifying our construction method (e.g., boring or horizontal directional drilling), location, timing, or scope based on our environmental review. These planning efforts are made in accordance with applicable federal, state, and local laws and regulations, along with input from regulatory agencies,[1] as appropriate based upon the project location and scope. When impacts to wetlands cannot be avoided, we mitigate project impacts by purchasing credits from wetland mitigation banks in accordance with U.S. Army Corps of Engineers regulations and guidance.
For construction projects with stormwater plans, sensitive habitat, or cultural resources, Atmos Energy provides oversight of the project during construction, monitoring environmental factors such as:
- Sensitive habitat areas, including nesting sites;
- Cultural resources;
- Wetlands and waterbodies;
- Proper handling of any spills
- Stormwater pollution prevention; and
- Restoration
Following the completion of construction, Atmos Energy continues its work to minimize its footprint, returning affected areas to their previous state through restoration and seeding. Where possible, we revegetate the project area by planting native grass seeds, which provide habitat and erosion control. When appropriate and with landowner approval, Atmos Energy uses a pollinator-specific seed mix to promote increased biodiversity value in the project area. Seed mixes are determined for each project location based on guidance from the Natural Resources Conservation Service (NRCS) for that region.
[1] Stakeholder federal agencies include United States (U.S.) Army Corps of Engineers, U.S. Fish and Wildlife Service, and U.S. Environmental Protection Agency.
Developing ’Learning Gardens’ for Communities and Schools
Atmos Energy is partnering with North Texas Health Communities Foundation to develop “learning gardens” at six schools across the Mid-Tex division. The first two gardens were built at William James Middle School in Fort Worth and Wimbish World Language Academy in Arlington, with four more scheduled for completion during the school year. Atmos Energy sponsored similar projects at Odessa (Texas) College, St. Cletus Catholic School in Gretna, La., Growing Garden Cities in San Angelo, Tx, and Top Crops in Bowling Green, Ky,
School gardens are linked to lower obesity rates, happier moods, and healthier habits that extend into adulthood. Students will learn how to grow different kinds of vegetables, how to maintain their very own garden, and the importance of nutrient-rich foods[1]. As an added benefit, the food grown can be packaged and donated to local food banks or to families in need across the community.
[1] Source: Texas Health Resources – Blue Zones Project

“The students, under our guidance, refreshed the beds with new soil, prepped, planted, and transformed the garden from empty boxes to a fully functional, flourishing garden. We went to the school with the mission of giving back to the community, and almost 150 students signed up for St. Cletus Catholic School’s Gardening Club who are now harvesting vegetables.”
Kaia Simmons, Public Affairs Manager
Texas Trees Foundation
 Atmos Energy joined the City of Sachse, Texas, in planting 50 trees to enhance J.K. Sachse Park as part of our long-standing partnership with the Texas Trees Foundation. Employees also helped Jubilee Park & Community Center in Southeast Dallas plant 15 trees, provide 100 free trees to local residents, and educate students about how a safe and healthy environment contributes to their well-being. In 2023, the City of Fort Worth and Texas Trees announced the development of an Urban Forest Master Plan. Atmos Energy’s sponsorship helps identify priority planting and preservation areas, reassess the citywide tree canopy, and make recommendations to the city’s Urban Forestry Management Section, which is charged with protecting healthy and significant trees and planting trees with land development to achieve the city’s goal of 30 percent overall canopy cover.

“Atmos Energy’s partnership in the historic urban forest plan with the Texas Trees Foundation and the City of Fort Worth demonstrates our commitment to helping create a sustainable and safe forestry management plan in addition to our dedication to fueling safe and thriving communities by investing in a safe and healthy environment.”
Bridget Wallace, Director of Marketing Services
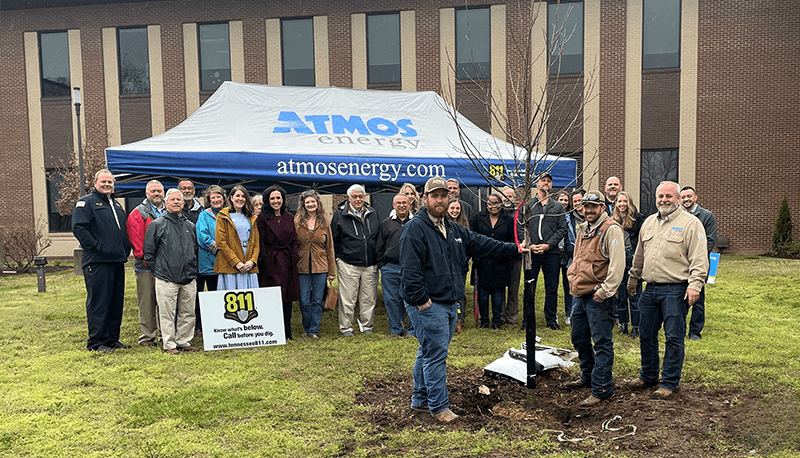 Each March, Atmos Energy sponsors Tennessee Tree Day, an annual event organized by the Tennessee Environmental Council. Each year, hundreds of pick-up sites distribute more than 100,000 trees to about 20,000 volunteers who plant them statewide. Atmos Energy employees planted trees and raised awareness of how to safely plant a tree by contacting 811 to have underground utility-owned lines marked before digging.
Facilities

Atmos Energy works to reduce its Scope 2 GHG emissions by improving the energy efficiency of our facilities and utilizing alternative energy sources. To facilitate this objective, we implemented a process to monitor electricity consumption across all of our facilities in 2023. This system helps us assess our Scope 2 emissions from electricity usage more accurately and identify opportunities to enhance efficiencies and reduce emissions.
Sustainable Facility Design
We have designed and built 17 LEED-certified[1] buildings, with three more certifications currently pending and two more buildings under development. The sustainable design of these buildings helps us avoid annual emissions of approximately 843 mtCO2e, 6.9 kg of sulfur dioxide, and 3.2 kg of nitrous oxide. Additionally, we estimate that our LEED-certified buildings reduce water usage by about 50% to 60% annually.
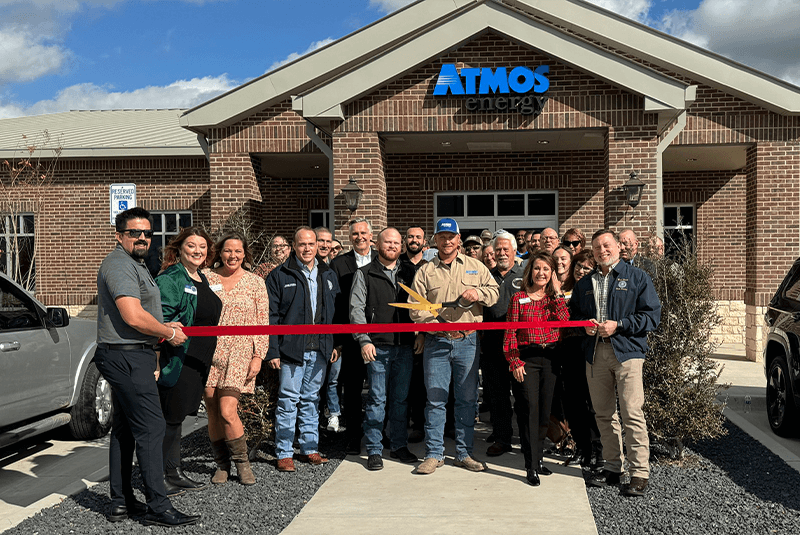
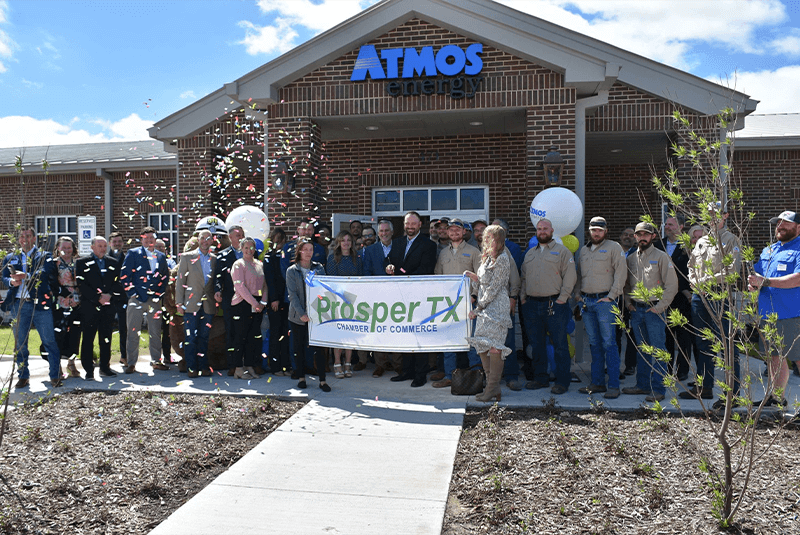
Grand opening ceremonies of the new LEED service centers in Prosper and Forney, Texas.
Alternative Energy Sourcing
We source approximately 5% of total purchased electricity from renewables. Additionally, we installed our first onsite solar panels at our Fort Worth and Haslet offices. We are evaluating other facilities for solar installation.
In fiscal year 2022, we installed our first natural gas-powered fuel cell at one of our Dallas, Texas, facilities. Fuel cells are efficient and reliable devices that generate electricity through an electrochemical reaction instead of combustion[2], making them a more sustainable power source. Following the installation of the fuel cell, site operations enable the generation of approximately 10% to 15% of our Texas electrical usage with natural gas-driven, sustainable, low-carbon power. Looking forward, we are evaluating the installation of additional onsite generation sources, like fuel cells and solar, at other Atmos Energy facilities. We plan to utilize renewable natural gas in the fuel cells, further reducing our facility-related carbon emissions.
Gas Supply
Renewable Gas Supply
Renewable Natural Gas (RNG) is an affordable and reliable waste-derived fuel used by homes, businesses, and even vehicles. RNG lowers Scope 1 GHG emissions and is 100% compatible with existing natural gas supply. Most of the potential renewable gas resources come from feedstocks like landfill gas, animal manure, water resource recovery facilities, food waste, agricultural residues, forestry/forest product residues, energy crops, renewable electricity, and municipal solid waste.
(Annual Bcf)
According to the EPA, municipal solid waste landfills are the third largest source of human-related methane emissions in the United States. Landfill gas producers capture and convert the emissions from landfills into a renewable energy source, thus preventing methane from migrating into the atmosphere.
Del Rio Dairy
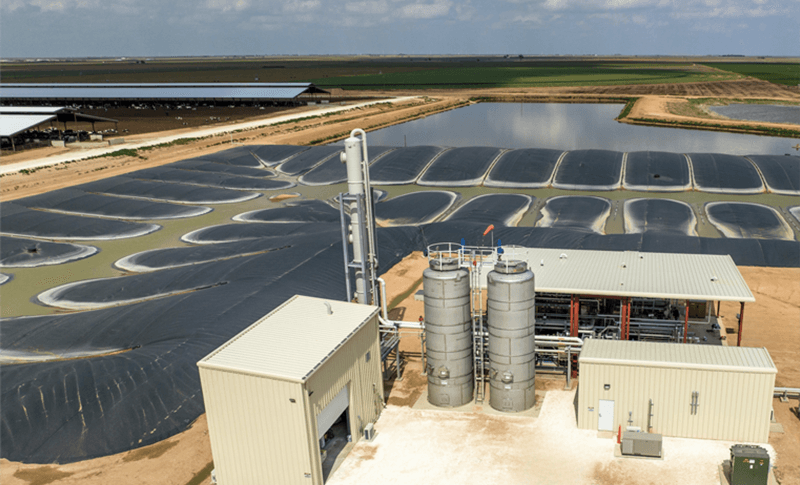
Del Rio Dairy, Friona Texas
In fiscal year 2023 Atmos Energy started transporting renewable natural gas (RNG) from the Del Rio Dairy, located in Friona, Texas. This project was the eighth RNG facility connected to Atmos Energy’s pipeline network and is a key demonstration of the role natural gas systems play in our lower carbon future. The Del Rio Dairy facility captures waste from more than 7,500 milking cows and is expected to generate over 1 million gallons equivalent of RNG annually, which Atmos Energy will transport for end use in homes, businesses, and vehicles.
Energy Efficiency for Customers
Energy Efficiency Programs
Energy efficiency programs are the most impactful opportunity to reduce emissions, while maintaining customer choice, lowering energy bills, and reducing overall energy consumption. Based on an American Gas Foundation study, GHG emissions from U.S. residential natural gas use could be reduced by as much as 40% from 2020 to 2050 through emerging energy-efficient natural gas technologies, at about 10% of the cost of electrification.
At Atmos Energy, we continue to work on reducing our Scope 3 GHG emissions through energy efficiency programs that help our customers conserve energy, save money, and reduce their environmental impact. We currently offer conservation and energy efficiency programs in Louisiana, Mississippi, Colorado, Mid-Tex, and Louisiana. These programs are marketed as SmartChoice Rebates and provide financial incentives to purchase high-efficiency natural gas equipment, like smart thermostats, and install home weatherization upgrades. We also provide free energy-saving devices such as water-reducing aerators, weatherstripping, and other air-sealing devices.
56,929
residential and commercial customers participated in energy efficiency programs
2.4
million therms of natural gas conserved
14,000
tons of CO2 emissions avoided annually
We educate and encourage our customers on how to save money and lower emissions. We provide tips to reduce energy use and make available state resources for low-income home weatherization on our website, monthly bills, and social media channels.
Achieving Zero Net Energy With Natural Gas

Atmos Energy partnered with Lafayette Habitat for Humanity to build the first ZNE home in Louisiana. Nearly 50 employees volunteered on multiple days to help build the 1,171-square-foot home, which was dedicated to the homeowner in the fall of 2023.
Zero Net Energy (ZNE) homes are designed to produce as much energy as they consume at an affordable cost to the homeowner through high-efficiency ENERGY STAR® natural gas appliances, rooftop solar panels, and high-performance building materials. In fiscal year 2021, we completed our first ZNE home project in Colorado. Since then, we have completed 12 more new ZNE homes in Kansas, Kentucky Louisiana, Mississippi, Tennessee, Texas, and Virginia.
These ZNE projects are part of a 20-year partnership with Habitat for Humanity to provide affordable, energy-efficient housing and demonstrate the important role of natural gas in fueling our energy future. The families in these modern ZNE homes experience the value and comfort of natural gas with significantly reduced greenhouse gas emissions and more affordable energy bills.

“Atmos Energy is proud of our partnership with Habitat for Humanity to design and build homes that provide efficient and reliable energy to homeowners, but also demonstrate that zero net energy is achievable with natural gas.”
Christina Christiansen, Manager of Public Affairs
E-Bill Is Convenient and Green
Our customers help us make even more of a difference in environmental stewardship. Since the inception of our Electronic Billing (E-Bill) program, more than 55% of Atmos Energy customers signed up for E-Bill. Additionally, electronic payment methods such as bank drafts, credit and debit cards, and other forms of online banking have increased to 85% of payments received. The E-Bill has saved more than 20,528 trees because of reduced paper use, equating to approximately 240 acres of forestland[1].

